
Let’s jump right in. For me, everything starts at the TOP. I take a top-down approach to trading. And when I say “the TOP”, I mean market direction.
Step 1: Is it a Bull or Bear Market?
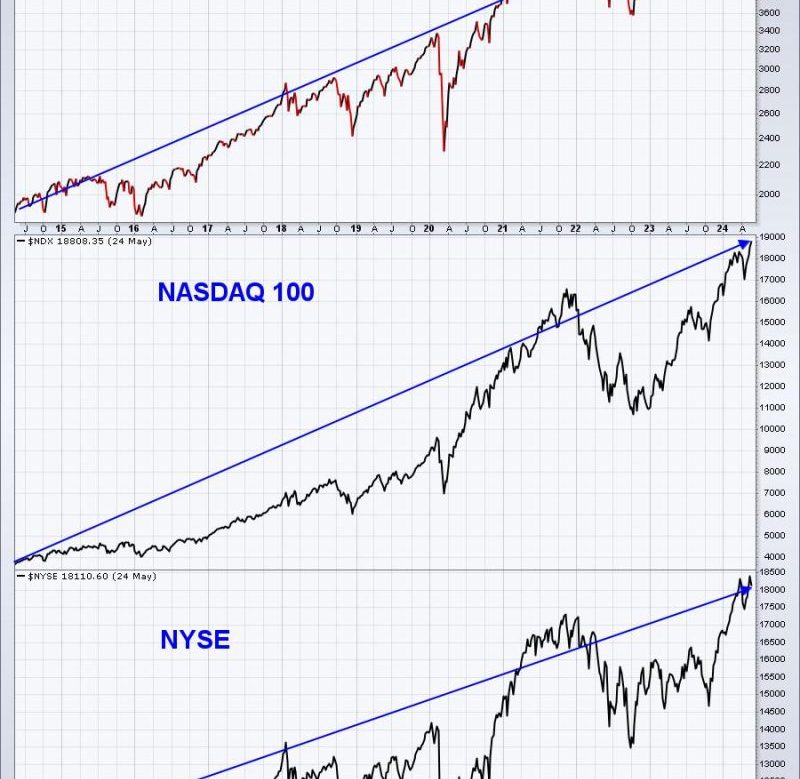
Listen, this is a very easy step to me. Look at a LONG-TERM chart of the S&P 500. Are prices moving UP from left to right? Or are they moving DOWN from left to right? It’s that simple. Stop trying to figure out why it’s going up or down. Don’t interject your own personal biases into it. Just look at the chart and answer the question:
I have stripped out nearly all technical indicators. There’s no volume. There are no momentum indicators like the PPO, MACD, RSI, or Stochastic. There are no moving averages. This is nothing more than a 10-year weekly price chart of the S&P 500, NASDAQ 100, and the broader NYSE. What do you see as you look across this chart from left to right? Is there a debate here? The stock market has been moving higher for YEARS (with occasional weakness)!!!! If you find yourself constantly being in cash or, worse yet, trying to short sell stocks, because YOU think stocks are overvalued, you have missed out on creating enormous personal wealth. STOP doing that!
We are heavily influenced by listening to news, whether you believe so or not. I remember my parents talking about the enormous debt of the U.S. back in the 1970s and that discussion has never ended. Meanwhile, $1 invested in the S&P 500 on January 1, 1980, is now worth $50 (prior to adjusting for inflation). So the absolute FIRST STEP in becoming a better investor/trader is to understand that your odds of making money are MUCH, MUCH BETTER on the long side than on the short side. Shorting stocks should be considered very infrequently and only when the chart is moving DOWN from left to right. Calling for repeated tops in a bull market is financial suicide. The trend is your friend, right?
Step 2: Sectors, Industries, and Stocks Are Not Created Equal
The Semiconductors Index ($DJUSSC) is an industry group loaded with high-octane, growth companies. As our economy and GDP grow, many of these companies find very exciting growth opportunities and take full advantage of them. This allows the LEADERS within this rising group to post gains that make accumulating massive wealth in the stock market possible. But not every group is high-growth like the semiconductor group. Companies in those slower-growth areas will never post that type of sustainable earnings growth. Yet we put way too much faith that the short-term growth rate in other industries will evolve into long-term growth like the semiconductors. It simply doesn’t happen that way and we lose money waiting for it.
Let’s compare semiconductors to several other industry groups within the aggressive sectors (XLK, XLY, XLC, XLI, and XLF) over a 20-year period. The 9 “other” industries are software ($DJUSSW), specialty retailers ($DJUSRS), gambling ($DJUSCA), internet ($DJUSNS), broadcasting & entertainment ($DJUSBC), fixed line communications ($DJUSFC), airlines ($DJUSAR), insurance brokers ($DJUSIB), and banks ($DJUSBK). The chart below is a 20-year weekly chart and each industry is shown as a ratio chart, relative to the benchmark S&P 500. See if you notice differences:
Look at these 10 different industry group RELATIVE charts. If you were to trade a stock in one of these industry groups, would it matter to you which of the industry groups above that it belonged to?
If I looked at the above charts and I was contemplating a trade in one or more of them, the very first question I’d consider is “what’s my time frame?”. If I’m thinking about a long-term swing trade, I would very much prefer for the stock to be in one of those industry groups in BLUE above – those showing much better long-term track records. If I were to look at a trade in say gambling, it would very likely be a quick, short-term trade. And if I did let the stock run, because it was performing well, I’d absolutely want to keep a trailing stop in play. The falling relative strength lines tells me that money is rotating AWAY from this RED group and into groups like those above in BLUE.
So, short-term I could trade stocks in any of the 10 groups, but from a longer-term perspective, I’d clearly be much more interested in the BLUE groups that are uptrending vs. the benchmark S&P 500.
I think that makes common sense, but I would bet that most traders don’t consider this.
Step 3: Trade Leading Stocks
There are a number of ways to evaluate relative strength, but one simple way that’s already a part of the StockCharts.com trading platform is to view top SCTRs (acronym for StockCharts Technical Rank). Personally, I would only tend to use the SCTR if I was looking at very recent performance. If you study the formula for the SCTR calculation, you’ll quickly realize that none of the formula is based on performance beyond 5-6 months. It’s a very near-term relative strength indicator, but a powerful one nonetheless, especially for those that are trading momentum in the very near-term.
You can pull up ChartLists using the Summary view and add the SCTR column. For instance, on our Raised Guidance ChartList (RGCL) that we research for our EarningsBeats.com members, here is how I can look for internet stocks that have raised their guidance in the past quarter, while also listing their SCTR score in order from strong to weak:
Personally, I’d concentrate much more on trading the above stocks with SCTRs at or above 75 and ignoring the rest. Remember, leading stocks in leading industry groups. That’s how you’ll improve your trading success.
Step 4: Exercise Patience and Use Great Timing Techniques
An impatient trader that simply wants to have money invested at all times is generally a bad trader. Buy stocks at YOUR price, not the price market makers want you to buy. In my experience, “chasing” trending stocks has resulted in my biggest and quickest losses. Many times, a stock becomes a leading stock after an excellent quarterly earnings report that’s accompanied by a gap higher in price. Chasing such a stock can be a big problem, especially if that stock “fills its gap”, or returns to the prior closing price before the gap. We try to coach our members to “stalk” stocks. Find stocks you like and then wait, wait, and wait a little bit longer. Buy them at key price/moving average support with tighter stops. That won’t eliminate poor trades, but it’ll certainly reduce your risk at the time of purchase.
Conclusion: Examples
Every weekend (or nearly every weekend), I provide my Fab 5 on YouTube, which is essentially 5 trade setups. Keep in mind that the risk of any trades you make is yours and yours alone, but I believe if you time your trades similar to these setups, you’ll experience better trading results over time. Check out this video:
Fab 5: 5 Stocks You Should Be Stalking Right Now
If you like these setups and would like additional setups more often, please SUBSCRIBE to our FREE EB Digest newsletter with only your name and email address. We provide “Charts of the Day” 3 times per week and the newsletter is absolutely 100% free! You may unsubscribe at any time.
Have a great holiday-shortened week ahead and happy trading!
Tom